Cloudflare Lets You Debug a Failed Browser Job Before Rerunning
Cloudflare Browser Run now records more evidence for debugging. Learn what to inspect before rerunning a broken browser job.
Published
 By Omid Saffari

Cloudflare changed the failed-run workflow on September 18, 2026. A completed Browser Run recording can now show you the console logs, network requests, and final page structure, so you can diagnose the evidence you already paid to create before launching another browser.
The change is an evidence pack after the run
A browser job used to leave you with its output, its error handling, and a replay if you had enabled Session Recording. When the failure did not explain itself, the usual move was to add more logging and run the job again.
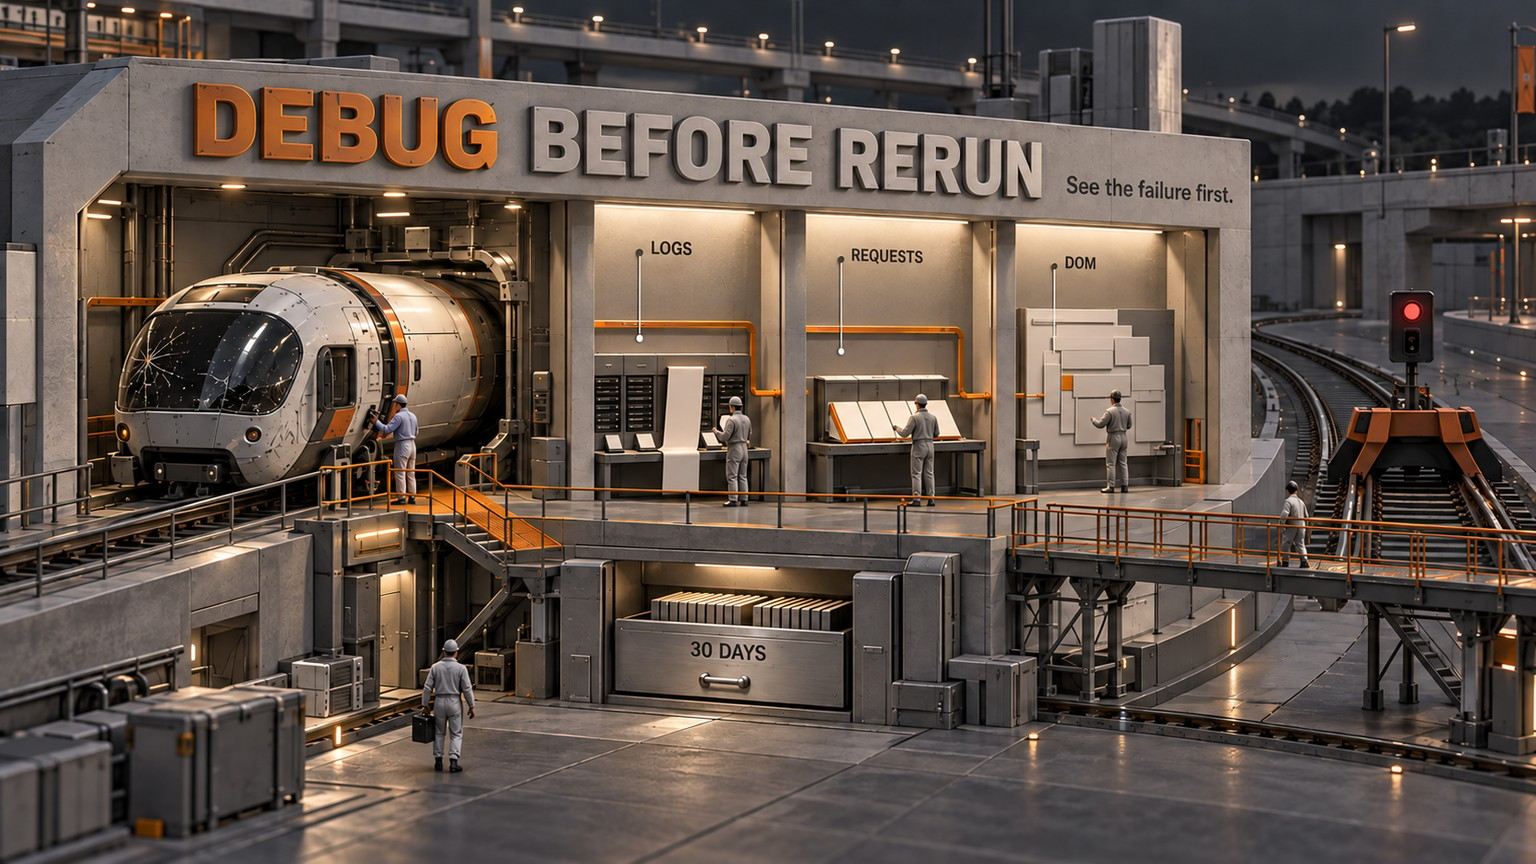
The new Inspect panel puts three views beside a completed recording:
- Logs lets you search captured console output and filter it by level.
- Network shows each request's method, status, headers, payload, response, and timing. You can export that activity as a HAR file, the standard archive format for a browser's request trail.
- DOM shows the page structure at the end of the recording and lets you copy the reconstructed HTML. DOM means the element tree the browser built from the page.
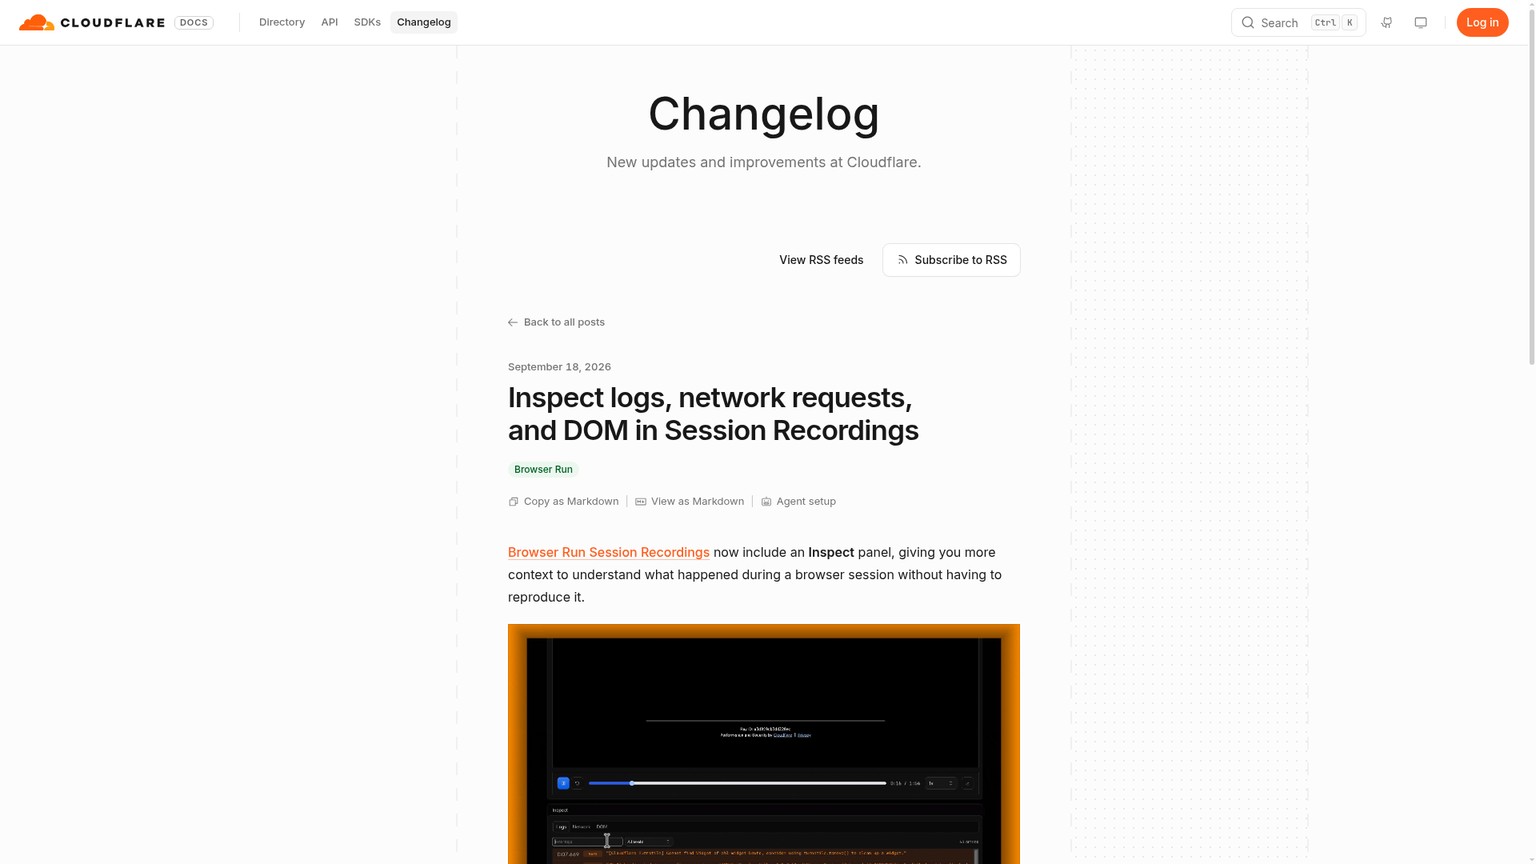
This is post-run evidence, not another live debugging surface. Cloudflare's Session Recording is structured rrweb event data rather than a video. It captures DOM changes, mouse and keyboard events, and navigation. The Inspect panel adds searchable clues around that replay after the session has closed.
That makes this release different from Cloudflare's earlier Browser Run change. Session guardrails and read-only Live View control where an active job may go and what a client may do while watching it. Inspect helps your own team explain why a completed job failed.
Which failures the record can reveal
The panel is useful when the failure left evidence in the browser.
A solo SaaS founder can find the rejected request
Say a recurring extraction job reaches the page but returns no data. The Network view can show whether an API returned 401, a rate limit returned 429, a redirect sent the browser somewhere unexpected, or one dependency consumed most of the run.
You can inspect the request and response details before adding temporary logging. The payoff is a smaller first diagnosis: fix the credential, backoff, redirect, or slow dependency that the existing run already exposed.
An agency lead can separate a page change from a script bug
A client workflow may fail because a selector changed, a login page replaced the expected screen, or an asset request returned an error. The final DOM and copied HTML show what the browser actually ended on. The request trail shows how it got there.
That gives the implementation team a concrete handoff. Instead of "the automation broke," they get the final element tree and a HAR containing the available headers, payloads, statuses, and timings.
A platform engineer can follow the right tab
The recording keys its event arrays by Chrome DevTools Protocol targets such as target-1, and each target typically represents one browser tab. A multi-tab recording exposes those targets separately, and the dashboard's Inspect panel follows the tab you select.
That matters for authentication handoffs and agent workflows. The login tab can succeed while the work tab fails. Target-specific evidence keeps those two stories from being mixed together.

Record one job and retrieve its network trace
Recording is opt-in. You have to enable it when the browser session is first acquired, and you cannot turn it on later while reconnecting to an existing session.
The smallest useful setup is one recurring Browser Session whose failures currently cause manual reproduction.
Enable recording at launch
Cloudflare's Puppeteer example passes
recording: truein the initial launch call. Keep the session ID before closing the browser:TypeScriptimport puppeteer from "@cloudflare/puppeteer"; interface Env { MYBROWSER: Fetcher; } export default { async fetch(request: Request, env: Env): Promise<Response> { const browser = await puppeteer.launch(env.MYBROWSER, { recording: true }); const page = await browser.newPage(); await page.goto("https://example.com"); // ... your automation steps ... const sessionId = browser.sessionId(); await browser.close(); return new Response(`Session recorded: ${sessionId}`); }, };Playwright uses the same launch option. A CDP connection uses
recording=truein its WebSocket URL.Ask for the completed recording
After the session closes, request the recording with its session ID:
Bashcurl https://api.cloudflare.com/client/v4/accounts/<ACCOUNT_ID>/browser-rendering/recording/<SESSION_ID> \ -H "Authorization: Bearer <API_TOKEN>"The response puts the event arrays under
result.events. Its keys, such astarget-1, are the target IDs you need for the network request. A new recording can briefly return404while Cloudflare finalizes it, so retry that lookup rather than treating the first404as a missing run.Retrieve the target's raw requests
Choose a target returned by the recording response. The
targetparameter is required:Bashcurl 'https://api.cloudflare.com/client/v4/accounts/<ACCOUNT_ID>/browser-rendering/recording/<SESSION_ID>/network?target=<TARGET_ID>' \ -H "Authorization: Bearer <API_TOKEN>"This returns the captured requests as JSON, including the available request and response details.
Export the HAR
Add
format=harwhen a developer needs the trace in a browser network viewer or another analysis tool:Bashcurl 'https://api.cloudflare.com/client/v4/accounts/<ACCOUNT_ID>/browser-rendering/recording/<SESSION_ID>/network?target=<TARGET_ID>&format=har' \ -H "Authorization: Bearer <API_TOKEN>"Treat that file as a debug artifact with a short access path. The documented response can include available headers and payloads, so it deserves the same handling as the job data it describes.
The easy mistake is enabling recording only after the first failure. There is no evidence to inspect retroactively. Start with a recurring job whose next failure matters.
The browser charge is not the main cost
Cloudflare's current Browser Run pricing lists no separate recording or recording-storage fee. A recorded Browser Session still sits on the normal browser-hours and concurrency bill. Session Recording is in beta, so treat that as today's published price, not a permanent promise.
Workers Free includes 10 browser minutes per day and three concurrent browsers. Workers Paid has a $5 monthly account minimum, includes 10 browser hours and 10 concurrent browsers, then charges $0.09 per extra browser hour and $2 per extra concurrent browser based on the monthly average of each day's peak.
The direct price of one diagnostic rerun is tiny. The labor around it is not. Here is a planning model, not a Cloudflare benchmark:
- The account is already past its 10 included browser hours.
- One recurring job takes 10 minutes and fails 12 times in a month.
- Reproducing and diagnosing each failure takes 20 operator minutes.
- Inspecting the existing record takes 5 operator minutes.
- Loaded operator time is assumed at $75 per hour.
- Inspection avoids one diagnostic rerun, but a later run may still be needed to verify the fix.
Only 18 cents of that difference is raw browser time. The other $225 is operator time. Cloudflare also rounds browser usage at the account level after totaling the billing cycle, so do not treat 1.5 cents for a 10-minute run as a line item that will appear on an invoice.
That is the business consequence. The Inspect panel does not turn browser compute into a major saving. It can remove one instrument, reproduce, and wait loop from an incident.
What the record cannot show you
The recording captures document state and events, not every rendered pixel.
Those limits define the failures that still need another diagnostic method. A chart drawn on a canvas, a checkout form inside a third-party iframe, a video state, a WebGL scene, or a value typed into a masked field can be wrong while the surrounding record looks normal.
The DOM view also shows the structure at the end of the recording. It can explain the page the job finished on, but it is not a pixel-perfect screenshot of every earlier state.
There are operating limits too. Recordings stay available for 30 days, last at least 1 second and at most 2 hours, and work with Browser Sessions through launch() or CDP. Quick Actions cannot create them. A very busy page can generate a large event stream because every frequent DOM change becomes recording data.
Who should change the workflow now
Act this week if you run recurring Puppeteer, Playwright, or CDP jobs and a failure usually starts with someone reproducing it. Add recording to one job, not every job, then measure whether the record answers the first diagnostic question.
Wait if the important state lives mainly in canvas, WebGL, media, a cross-origin iframe, or masked form fields. Keep screenshots, application logs, and targeted instrumentation in that path because the recording cannot replace them.
You are unaffected if your work stays on Quick Actions. Moving to Browser Sessions only for recording changes the implementation and adds concurrency to the pricing model, so the debugging benefit has to justify that move.
The Monday move
Pick one recurring Browser Session that has failed more than once. Add recording: true at its initial launch, store the session ID beside your own job ID, and let the next scheduled run close normally.
Then retrieve the recording, take its first relevant target ID, and request the raw network trace or HAR. Time how long it takes to name the failing request or final page state. If that evidence removes one diagnostic rerun, keep recording on that job and make the trace part of its incident record. If it does not, turn it back off and add the missing signal where the blind spot actually lives.
If you want more operator-level explanations of platform changes, join the newsletter.
- Published
- Category
- Explained
- Language
How Much Does an AI Agent Cost? Three Monthly Bills, Explained
Compare packaged agents, no-code builders and model APIs, with current maker prices and three worked budgets for 1,000 support emails a month.Oct 7, 2026Explained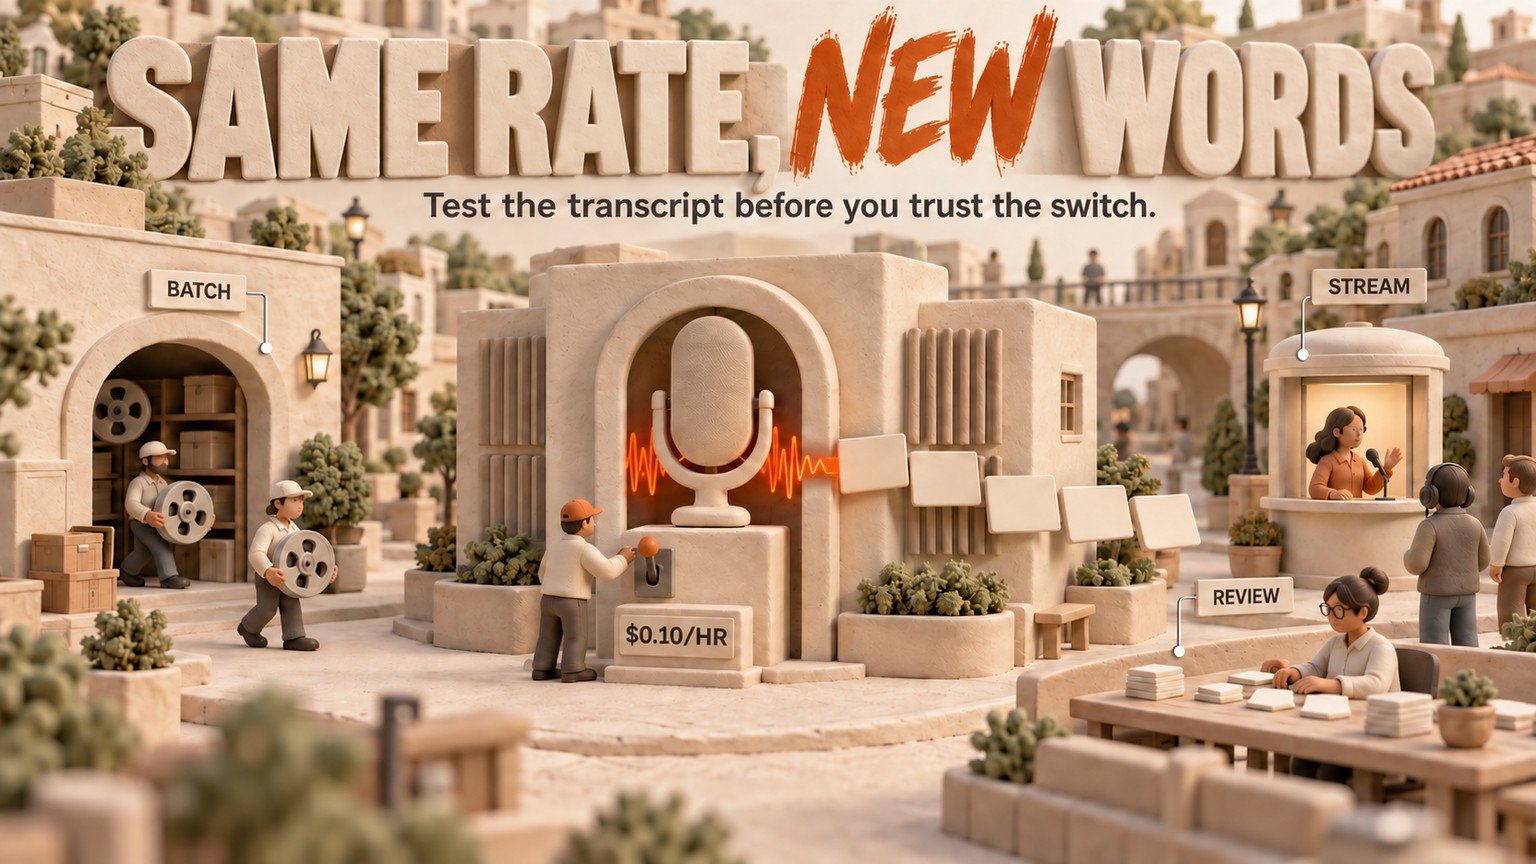
Grok Voice Transcribe 2.0 Keeps Batch Audio at $0.10/Hour
Grok Voice Transcribe 2.0 keeps batch and streaming rates unchanged. Check the default-model transition and test transcript quality before switching.Sep 20, 2026Explained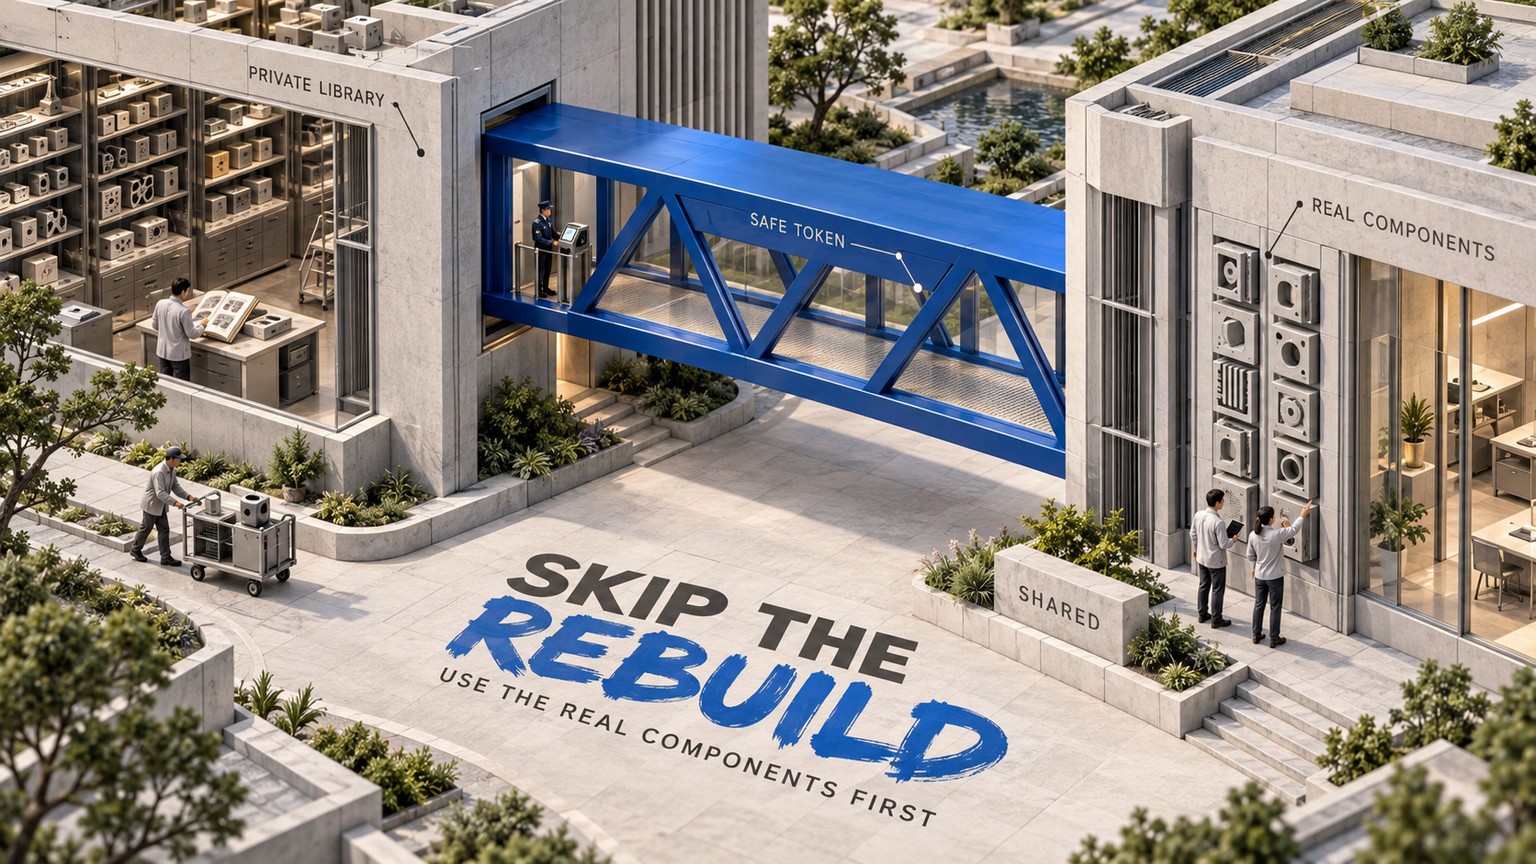
v0 Can Now Reuse Your Private Component Library
v0 can now install private npm packages. See how to reuse your team's components and check the work still needed before shipping.Sep 19, 2026Explained
Claude Code Cuts Auto Mode Classifier Charges
Claude Code 2.1.278 removes classifier charges for eligible sessions. Check /status and gateway fallback before changing your agent budget.Sep 19, 2026Explained
Vercel Lets You Pay for Faster Builds One Deploy at a Time
Use Vercel Turbo for an urgent deployment while keeping routine build defaults. Compare the extra build cost with the time saved.Sep 18, 2026Explained
ChatGPT for Word Cuts Document Copying Between Apps
Draft and revise inside Word with ChatGPT. Check add-in access, shared usage limits and a practical document-editing workflow.Sep 18, 2026Explained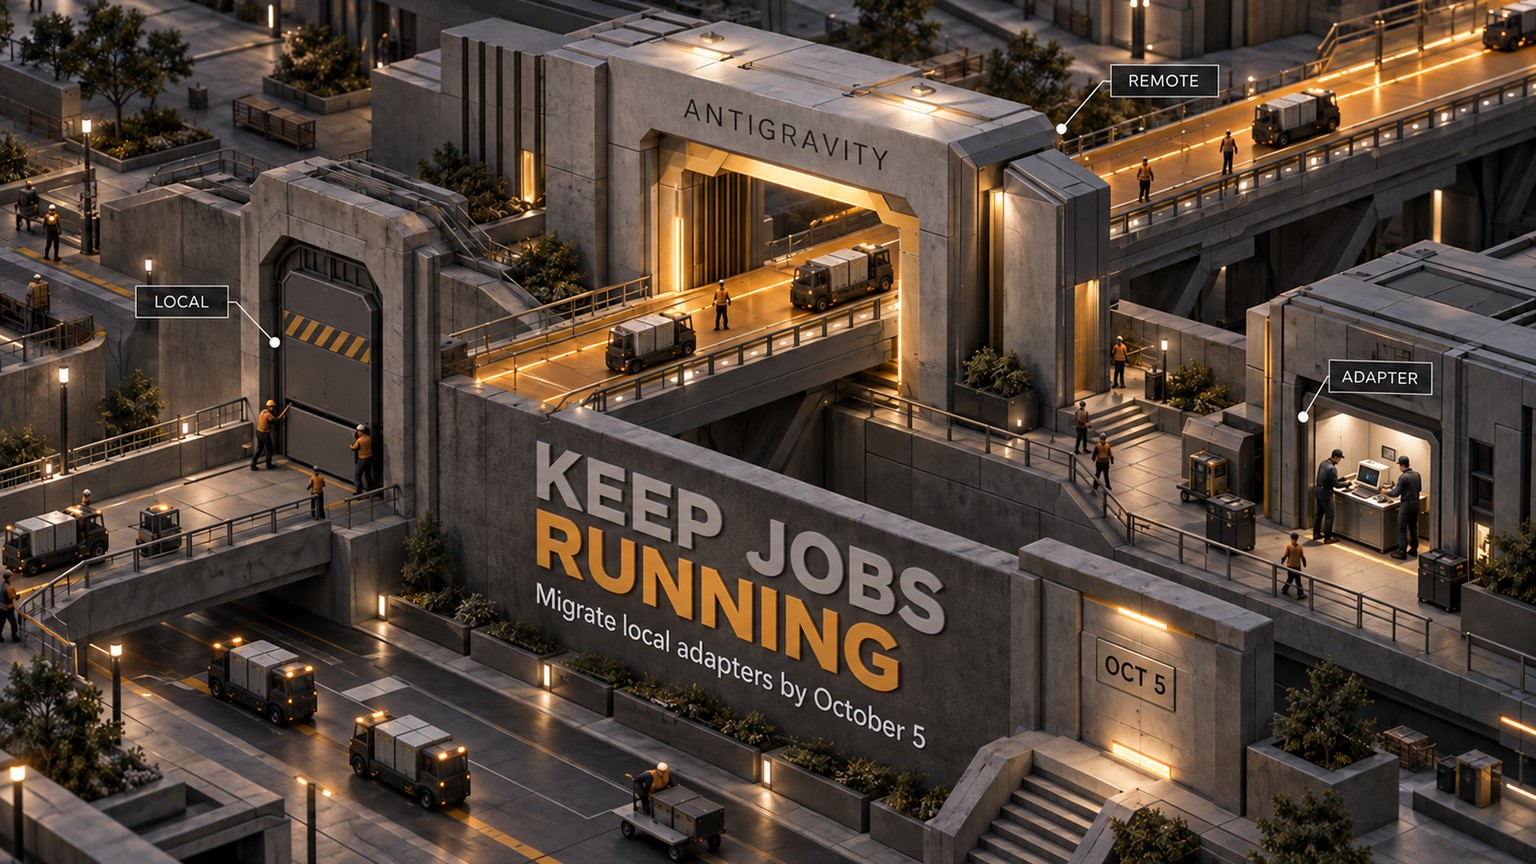
Antigravity Local Jobs Need an October 5 Migration
Keep Antigravity jobs running after October 5. Learn which integrations need new tool adapters and which only need the new agent ID.Sep 18, 2026Explained