Cloudflare Shows Which Worker Slowed a Customer Request
Follow a slow request across Cloudflare Workers and Durable Objects, find the slow call, and check tracing costs before rollout.
Published
 By Omid Saffari

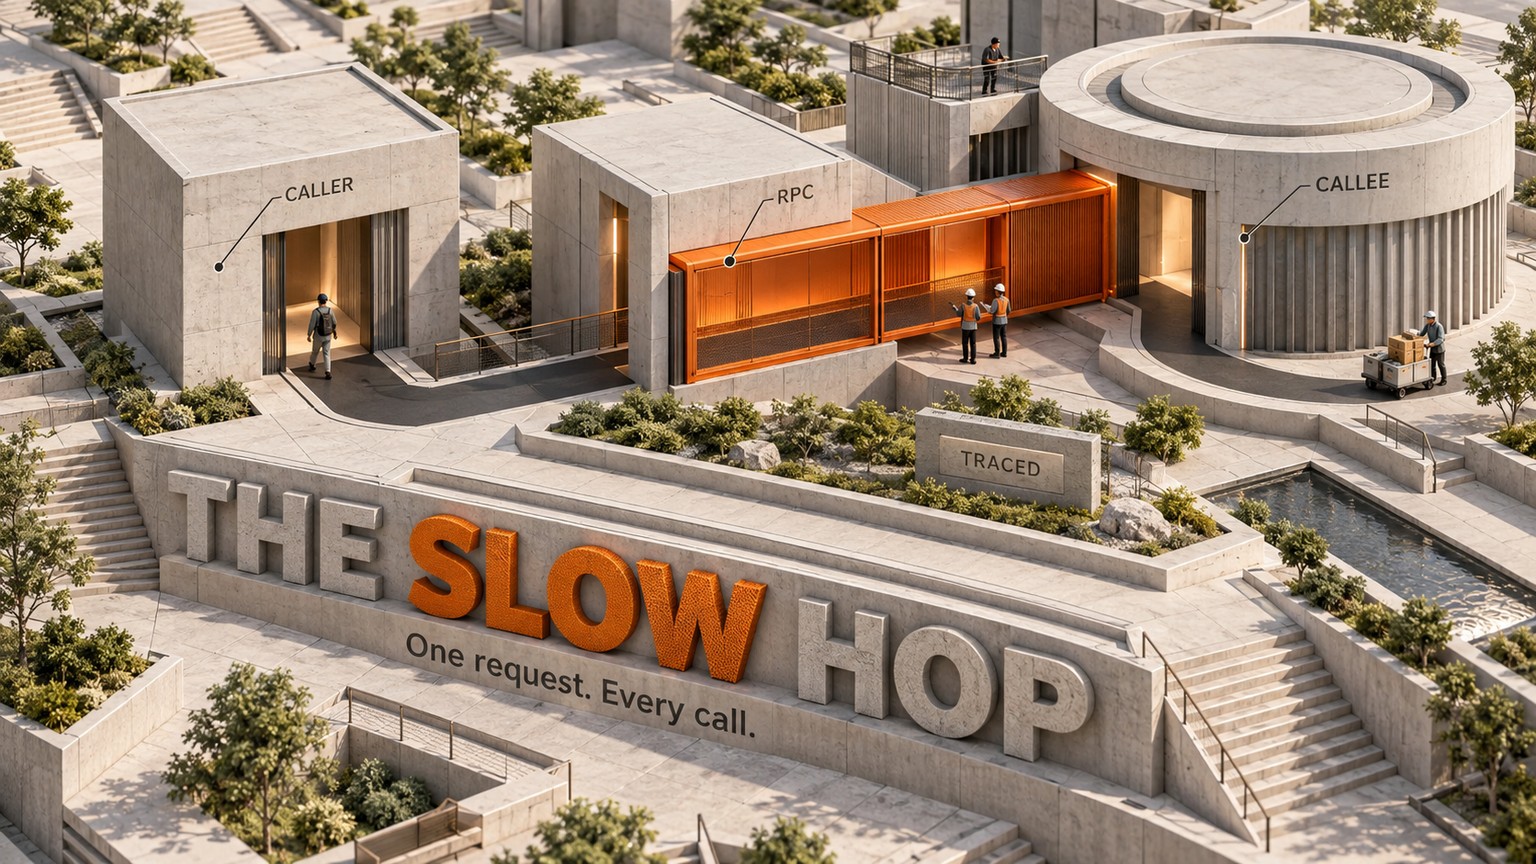
On September 17, 2026, Cloudflare made a slow customer request easier to assign: Workers tracing can now follow a JavaScript RPC call into another Worker or Durable Object instead of stopping at the caller. You can see which service and method held up the request before adding manual spans or blaming the whole stack.
The useful change is the missing middle
RPC sounds more complicated than it is. In Cloudflare Workers, a remote procedure call is one Worker calling a public JavaScript method on another Worker or Durable Object through a binding. The code feels like a local method call, but the work runs somewhere else.
A trace is the timeline for one request. Each timed piece inside it is a span. Until this release, that timeline stopped when the caller crossed a JavaScript RPC boundary. You could see Worker A make the call, but not connect that call cleanly to the work running in Worker B or a Durable Object.
Cloudflare's September 17 release fills that gap. The same trace can now show the caller-side session, each method call, the callee invocation, nested calls, and callbacks into another Worker. Cloudflare records those spans automatically once tracing is enabled. You don't need to add an observability SDK or change the application code for this platform instrumentation.
The session span is the container for the caller-side RPC session. Calls that reuse the session sit inside it. Individual call spans carry the method or property path, while the callee gets its own invocation span. Color changes mark where execution moves between Workers or into a Durable Object.
That turns a blank boundary into an ownership map.
Follow one checkout request
Take a customer request to POST /checkout.
The request first reaches a checkout Worker. That Worker calls inventory.reserve() on an inventory Worker, then calls order.commit() on an order Durable Object. The customer only sees one slow checkout, but the application has three places where the wait could live.
Before this change, the checkout trace could end at the RPC call. You would need logs from each service, matching identifiers, or custom spans to reconstruct the rest.
Now the trace can keep the request together. You can expand the RPC session, find the reserve and commit method spans, see the downstream invocations, and compare where the wall time sits. Root spans can also carry the Cloudflare Ray ID, Worker name, entrypoint, outcome, CPU time, and wall time, which gives an incident responder useful handles for finding the right request.
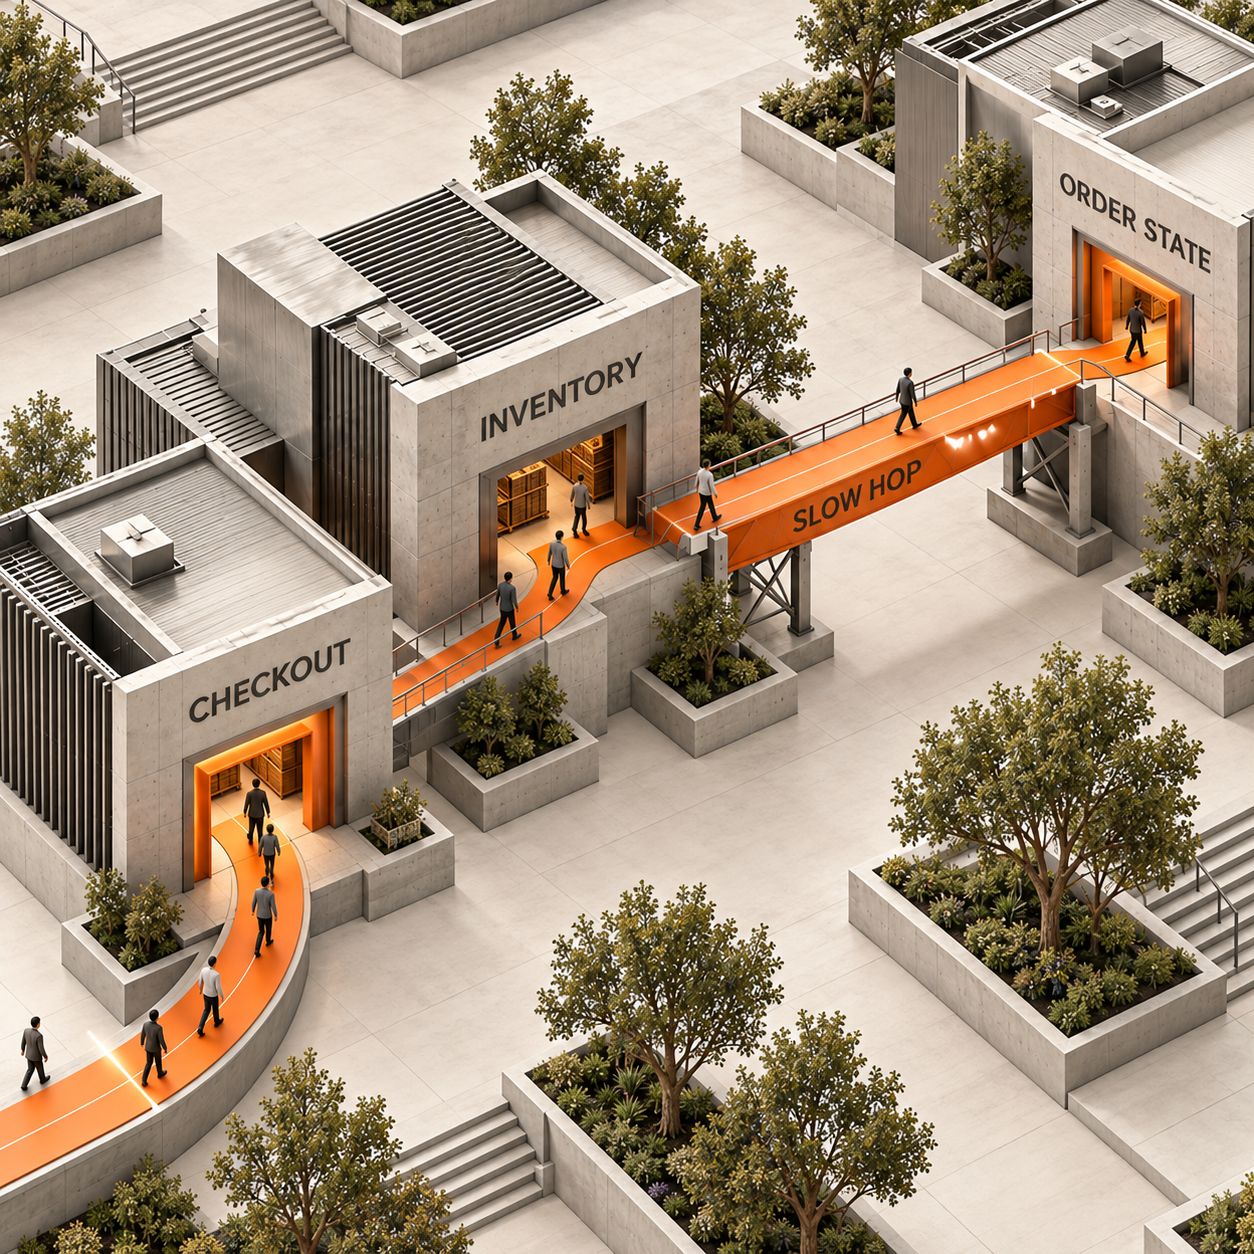
The new view does not prove why a method is slow. It tells you where to look next. If the inventory invocation owns most of the wait, inspect its storage or upstream dependency. If the Durable Object call is the wide span, inspect that object's handler and storage work. If the caller is slow before either RPC begins, the downstream services are not your first suspect.
Who gets value from this
A solo founder with a split backend
A founder running checkout, inventory, and order state as separate Workers can reproduce one slow purchase and follow it across the whole Cloudflare path. The payoff is a smaller fix surface. You investigate the Worker or Durable Object that owns the delay instead of reopening every service.
A backend lead on a stateful product
A collaboration app may route a room action through an edge Worker into a room Durable Object. The backend lead can separate time spent in the caller from time spent inside the stateful object, then hand the trace to the team that owns that boundary.
A platform engineer with internal Worker services
A platform team may have several Workers connected through service bindings, with returned stubs and callbacks creating a path that is hard to reconstruct from logs. Session and method spans show which calls reused a session, which Worker executed each part, and where a nested call entered the path.
A support lead turning a report into evidence
Support can ask engineering to reproduce the same route while the incident details are fresh. The resulting trace gives the handoff a named service and method boundary instead of "checkout felt slow." That is useful even when the eventual fix still needs logs, a profiler, or a database query plan.
Run the Monday test
The useful first rollout is one request path, not every production Worker at once.
Choose a customer-visible path
Pick a request that already crosses a Worker-to-Worker or Worker-to-Durable Object RPC boundary and has a repeatable slow case. Write down the route, the expected downstream method calls, and the time you will reproduce it.
Enable traces in Wrangler
Add the setting Cloudflare documents to the Wrangler configuration for the Worker handling that path:
Jsonc{ "$schema": "./node_modules/wrangler/config-schema.json", "observability": { "traces": { "enabled": true } } }Deploy that configuration through your normal release path. This switch enables Cloudflare's automatic spans. It does not require an SDK inside the Worker.
Reproduce one slow request
Run the same request once under controlled conditions. Keep the route, timestamp, and Cloudflare Ray ID if your support or logging flow already captures it. A controlled environment is cleaner because the default trace sampling rate is
1, which means 100% of incoming requests are traced when you do not set another rate.Read the trace from the outside in
In Cloudflare, go to Workers & Pages, select the Worker, then open Observability. Find the reproduced request and expand its trace. Start with the root request, then follow the RPC session, the caller method span, the callee invocation, and any nested Durable Object call. Use the span width and wall-time fields to locate the boundary that deserves the next investigation.
Measure the bill before the rollout
Record how many spans the reproduced trace created. Then estimate monthly trace events as
sampled requests × average spans per sampled trace. Add the log events already using the same observability quota. That measured span count is the input for your production sampling decision.
The cost is per span, not per request
Workers tracing is free during its initial beta period. That changes on October 1, 2026. From that date, each span counts as one observability event and shares the same quota and pricing as Workers Logs.
Enterprise teams need to check their contract. Everyone else should notice the billing unit: one customer request can produce a root span, an RPC session span, method-call spans, callee invocations, and nested binding spans. The request count alone cannot tell you the trace bill.
Cloudflare's tracing documentation says the default head_sampling_rate is 1, or 100%. Its high-traffic example uses 0.05, which traces five of every one hundred incoming requests. That example is a control, not a universal answer.
Head sampling makes the trade-off plain. A smaller rate cuts event volume, but the decision happens at the start of the request. A rare slow request may not be selected. Use full sampling for a controlled reproduction or a suitably isolated environment, then choose the production rate from actual traffic and measured spans per trace.
Retention changes the incident workflow too. Free-plan traces last 3 days and Paid-plan traces last 7 days. If customer reports arrive after that window, the trace you needed may already be gone. The operating rule is simple: reproduce and inspect while the evidence still exists, or export traces into a system with the retention your process needs.
The honest limits
Workers tracing is still in open beta. Span and attribute names can change, and Cloudflare says some attributes remain incomplete.
Some non-I/O spans can show 0 ms even when work took longer. The Workers Runtime does not update time until an I/O event occurs, so a zero is not proof that a piece of JavaScript was free.
The trace also stops being automatic outside Cloudflare. When you export Workers traces, Cloudflare does not yet propagate trace IDs into external services. A call into a payment provider or a database hosted elsewhere will not automatically join its vendor-side trace to the Workers timeline.
Finally, this release is narrow. A single Worker with no JavaScript RPC boundary does not gain a new cross-service view. General Workers tracing may still help with fetches, bindings, and handlers, but the September 17 change matters most to applications already split across Workers or Durable Objects.
What to do now
Act this week if customer requests cross service bindings or Durable Objects and your team currently stitches several logs together to find a slow hop. Start with the path that creates the most expensive support or incident work.
Wait if the application is still one Worker, or if the suspected delay lives entirely in an external provider. This release does not create a joined trace outside Cloudflare.
If tracing is already enabled, inspect the new RPC spans before adding custom instrumentation. Add custom spans only after the automatic trace shows a meaningful gap inside the method you own.
The Monday move is small: enable observability.traces.enabled for one real request path, reproduce the slow request, inspect the RPC session and method spans, then write down the sample rate, average spans per trace, retention window, and expected quota use before widening the rollout.
If you want one clear operator note when a platform change alters the work or the bill, join the newsletter.
- Published
- Category
- Explained
- Language
How Much Does an AI Agent Cost? Three Monthly Bills, Explained
Compare packaged agents, no-code builders and model APIs, with current maker prices and three worked budgets for 1,000 support emails a month.Oct 7, 2026Explained
Grok Voice Transcribe 2.0 Keeps Batch Audio at $0.10/Hour
Grok Voice Transcribe 2.0 keeps batch and streaming rates unchanged. Check the default-model transition and test transcript quality before switching.Sep 20, 2026Explained
Cloudflare Lets You Debug a Failed Browser Job Before Rerunning
Cloudflare Browser Run now records more evidence for debugging. Learn what to inspect before rerunning a broken browser job.Sep 19, 2026Explained
v0 Can Now Reuse Your Private Component Library
v0 can now install private npm packages. See how to reuse your team's components and check the work still needed before shipping.Sep 19, 2026Explained
Claude Code Cuts Auto Mode Classifier Charges
Claude Code 2.1.278 removes classifier charges for eligible sessions. Check /status and gateway fallback before changing your agent budget.Sep 19, 2026Explained
Vercel Lets You Pay for Faster Builds One Deploy at a Time
Use Vercel Turbo for an urgent deployment while keeping routine build defaults. Compare the extra build cost with the time saved.Sep 18, 2026Explained
ChatGPT for Word Cuts Document Copying Between Apps
Draft and revise inside Word with ChatGPT. Check add-in access, shared usage limits and a practical document-editing workflow.Sep 18, 2026Explained